Software Process Mapping: Practical Guide to Streamline Workflows
Introduction
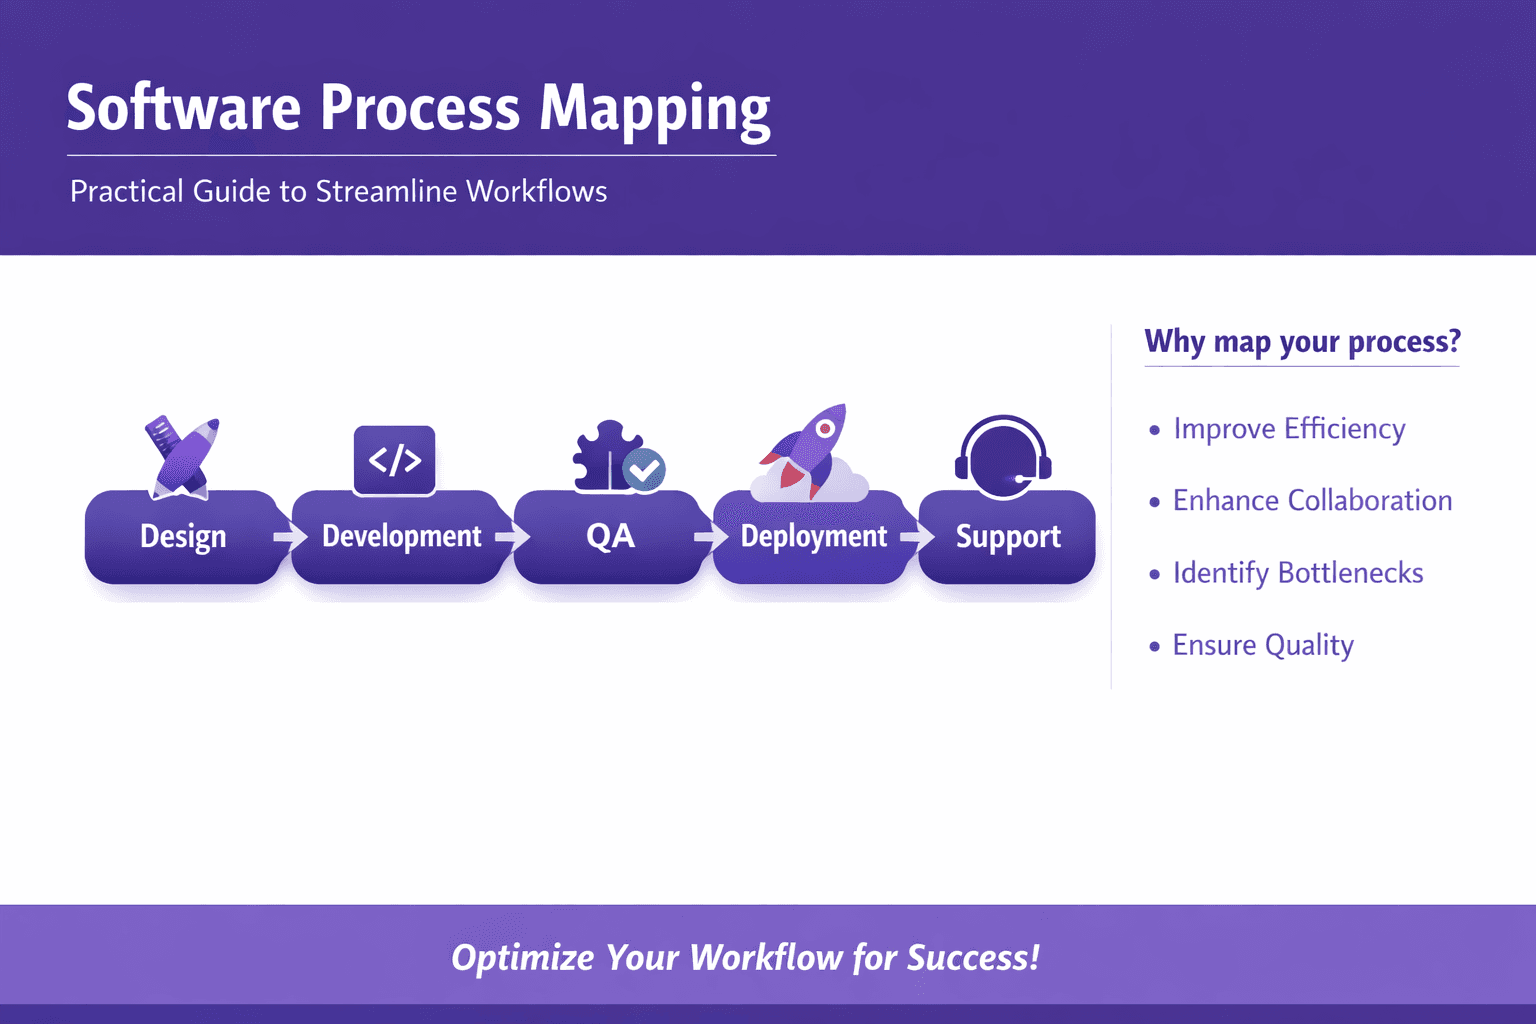
Software process mapping is the disciplined act of taking how work actually gets done in software teams — design, development, QA, deployment, support — and turning that into a visual, testable model. That model can be a high-level flowchart for leadership, a BPMN diagram for architects, or an executable map that feeds RPA and automation tools. The point isn't drawing pretty boxes. It's making work visible so you can reduce waste, speed releases, and stop burying knowledge in people's heads.
Who benefits? Short answer: almost everyone who touches software delivery or the business processes around it. Business analysts and consultants use maps to find inefficiencies. Operations managers use them to set SLAs and improve handoffs. Automation roles — RPA developers, SREs, platform engineers — use maps to find automation candidates and avoid fragile scripts. Product owners and compliance officers get clearer governance. Even frontline trainers get better onboarding material.
This article gives you a practical, step-by-step guide to software process mapping: when to map, how to pick the right scope, how to collect real data (not just opinions), the notations and tools that matter, and how to move from maps to automation pilots and measurable outcomes. You'll also get templates, checklists, and real examples you can reuse immediately.
Why Software Process Mapping Matters
You already know undocumented work wastes time. Maps make that waste visible and actionable.
Concrete benefits:
- Clarity: Everyone sees the same steps, handoffs, and decision points. That reduces "you said" vs "I thought" arguments.
- Reduced cycle time: Remove waits and unnecessary approvals. A single duplicated manual step can add days.
- Fewer defects: When handoffs are clear and entry/exit criteria are defined, fewer bugs slip in.
- Better handoffs and governance: Maps expose unclear ownership, which you can fix with RACI or SLAs.
- Repeatable automation: A documented process is a prerequisite for safe automation.
Business outcomes you can measure:
- Cost savings: Automating repetitive tasks or removing rework can cut operational costs by 10%–40% depending on the process.
- Faster releases: Clear build, test, and deployment flows shorten release cycles. Teams that map release pipelines often cut deployment time from days to minutes.
- Improved customer experience: Faster incident resolution and smoother onboarding translate to higher NPS and reduced churn.
How mapping supports continuous improvement and automation
- Maps are the baseline for change. If you want to run Kaizen sprints, you need a map and the metrics tied to each step.
- Process mining turns event logs into maps so you can validate the "as-is" with real data.
- Once an executable map and good metrics exist, you can safely pilot automation (RPA, workflow orchestration, CI/CD pipelines), then scale using clear acceptance gates.
Real example: a SaaS company's support-to-fix flow At one SaaS company I worked with, the support-to-fix cycle involved 7 handoffs across support, dev, and security. Mapping revealed a 48-hour wait caused by an unclear triage decision and duplicate bug reports. They introduced a one-page triage checklist + an automated ticket enrichment step (pull logs and environment info using an integration) and cut mean time to resolution from 72 to 28 hours.
When to Map and How to Prioritize Processes
You can't map everything. Prioritize.
Selection criteria to map first:
- Impact: revenue, customer experience, regulatory exposure. Example: payment processing, subscription changes, chargebacks.
- Frequency: processes that run daily or thousands of times a month. Small gains multiply.
- Pain points: frequent incidents, repeated rework, high error rates, long cycle times.
- Compliance: audits, security reviews, GDPR/PCI workflows that require traceability.
Quick prioritization matrix
- X axis: Frequency (low to high)
- Y axis: Impact (low to high)
- Map top-right first: high frequency, high impact.
Scoping: how much detail?
- High-level (value stream / level 1): Use this for strategy and to get buy-in. Show major phases: Request → Intake → Build → Release → Support.
- Mid-level (swimlane flow / level 2): Show role boundaries and key decision points. This is where policies and RACI live.
- Detailed executable (level 3+): Step-by-step actions with specific inputs/outputs, system API calls, and exact acceptance criteria — needed for automation or SOPs.
Don't try to go from zero to executable on the first pass. Start high, prove value, then drill down on the biggest hotspots.
Stakeholder alignment and getting buy-in
- Identify the "power users": the people who live the process daily and the people who sign the checks. You need both.
- Use short workshops — 45–90 minutes — with artifacts prepared. No one wants to sit in a "process mapping" meeting that feels aimless.
- Show quick wins early: a 15-minute change to a handoff form that reduces follow-ups is worth more than perfect diagrams.
- For IT and product owners: align on automation goals and data access early. Automation needs event logs and APIs.
Practical tip: run a 1-hour "map sprint" with a whiteboard, a laptop to pull logs, and 3 stakeholders (support lead, developer, analyst). You’ll be surprised how much consensus appears in an hour.
Step-by-Step Guide to Creating a Software Process Map
This is the hands-on part. I'll give you steps you can follow today.
1) Discovery — gather facts, not opinions
What to collect:
- People: interview the top 3–5 participants (not just managers). Ask them to walk you through a real case they handled recently.
- Documents: SOPs, runbooks, and incident reports.
- System logs: ticket systems, CI/CD pipelines, monitoring alerts. These are gold.
- Metrics: throughput, cycle time, SLA breaches, defect counts.
- Screen recordings and training videos: these often show undocumented workarounds.
Techniques:
- Interviews: use "show me" questions. Ask: "Open a ticket you handled and walk me through the next steps." Avoid hypotheticals.
- Process mining: feed event logs from Jira, ServiceNow, Git, Jenkins into Disco, Celonis, or UiPath Process Mining to extract the actual flows.
- Shadowing: sit with someone for a morning and record their actions.
- Screen recording processing: tools like Lyren AI can convert screen recordings and UI videos into step-by-step documentation and flow diagrams, saving hours.
Example SQL for system logs you can run quickly If you can access a ticket system export, this simple query orders events to create an event log for process mining:
SELECT case_id, activity, timestamp, actor
FROM event_log
ORDER BY case_id, timestamp;
Common discovery pitfalls:
- Relying only on management descriptions. Managers can be surprisingly disconnected from day-to-day steps.
- Clean data assumption. Event logs often miss timestamps or have inconsistent naming; plan a data-cleaning step.
2) Modeling — choose notation and break the process down
How to pick a notation:
- If you want automation or to hand diagrams to developers, use BPMN (Business Process Model and Notation). It's standardized and many tools support executable BPMN.
- If you want speed and stakeholder clarity, use flowcharts or swimlane diagrams.
- For high-level supplier/customer view, use SIPOC (Suppliers, Inputs, Process, Outputs, Customers).
- For lean optimization, use Value Stream Mapping to highlight wait times and non-value steps.
What to include in a good map:
- Activities (what’s done)
- Decisions (where choices are made)
- Roles or swimlanes (who does it)
- Inputs/outputs (documents, APIs, artifacts)
- Metrics per step (cycle time, error rate)
- Exceptions and rework loops
Modeling tips:
- Keep each activity to one actor and one primary action. "Engineer reassigns and triages" is two actions; split it.
- Use consistent naming: "Create ticket" not "Ticket creation" in other steps.
- Add annotations for system calls: "POST /api/issue" or "Query: GetCustomerById".
- Color-code automation candidates: green for manual but repetitive, orange for decision-heavy, red for hard exceptions.
Example: bug triage flow (mid-level)
- Customer reports bug (support)
- Support reproduces and attaches logs (support)
- Support triages severity and assigns to queue (support)
- Automated enrichment grabs environment metadata (automation)
- Developer reviews and marks fix or needs more info (developer)
- If needs more info, loops back to support (rework)
- If fix, moves to QA (QA)
- QA signs off and release pipeline triggers (CI/CD)
3) Validation — workshops, walkthroughs, iterate
You can’t model in a vacuum.
Validation steps:
- Run a walkthrough workshop where you take one or two real cases and "replay" them against the map. Ask: did the map capture the actual steps? Where did reality differ?
- Bring in people who don't touch the day-to-day but rely on outcomes (product manager, compliance). They often spot missing governance requirements.
- Use process mining outputs to show common variants. If 60% of cases follow variant A and 30% go to variant B, your map should reflect that.
Iteration cadence:
- Initial map: one workshop + 2 follow-up reviews — aim for a 2-week turnaround.
- Detailed executable maps: several iterations as you define system calls and test cases.
Validation red flags:
- Too many exceptions: if 50% of cases are exceptions, you probably need to model those exceptions separately or revisit scope.
- Stakeholder disagreement on a core step: pause and get a live case to reconcile.
4) Maintaining maps — versioning, ownership, governance
Maps rot if left alone. Here's how to keep them useful.
Ownership
- Assign one process owner per map (this is usually a manager or lead).
- Assign a documentation owner for day-to-day edits (analyst or an ops doc specialist).
Versioning and storage
- Keep canonical maps in a versioned tool: Git for BPMN (yes, you can store XML), or Signavio/Confluence with version history.
- Tag changes with a short changelog: "2026-01-15: Added automated enrichment step."
Governance practices
- Quarterly reviews for mission-critical maps.
- Change control: any change that affects SLAs or automation requires sign-off from product, security, and IT.
- Use template checklists for map updates: what metrics change, are any APIs affected, who needs training.
Practical: integrate maps with runbooks
- Link the step in the map to the runbook or Lyren AI-generated SOP for that step. When a map changes, the link signals which SOPs to review.
Notations, Tools and Templates
Pick the right tool for the job. You don't need everything.
Notations compared
- BPMN (Business Process Model and Notation)
- Pros: Standard, expressive (events, gateways, subprocesses), can be executable.
- Cons: Has a learning curve; diagrams can get dense.
- Flowcharts
- Pros: Fast, accessible to non-technical stakeholders.
- Cons: Less expressive for parallelism and events.
- SIPOC
- Pros: Great for high-level supplier/customer context and kickoff sessions.
- Cons: Not detailed enough for automation.
- Value Stream Mapping
- Pros: Shows value vs waste and highlights wait times.
- Cons: Lean-focused; less useful for complex branching logic.
My take: use flowcharts or swimlanes to get buy-in, then formalize the critical flows into BPMN when you plan automation or need governance. Keep SIPOC for process discovery.
Tool recommendations — who should use what
- Analysts & Consultants: Lucidchart, Microsoft Visio, Miro for rapid collaborative mapping. They make workshops easy and exports clean for clients.
- Product & Engineering: Signavio (SAP Signavio) for enterprise modeling, BPMN support, and governance. Good for linking to requirements.
- Process Mining: Celonis and UiPath Process Mining are leaders. Fluxicon Disco is great for quick exploration of event logs. Apromore is an open-source alternative.
- RPA & Automation Teams: UiPath Studio, Automation Anywhere, Blue Prism for RPA; Camunda or Zeebe for workflow orchestration.
- Knowledge capture & SOP generation: Lyren AI can convert screen recordings and UI videos into structured step-by-step documentation and generate process diagrams — a huge time-saver when you need accurate "how-to" steps from real work.
Tool shortlist by task
- Quick workshop maps: Miro, Mural
- Formal documentation and diagrams: Lucidchart, Visio
- Enterprise process governance and executable BPMN: Signavio, Camunda
- Event log mining: Celonis, UiPath Process Mining, Disco
- Screen recording to documentation: Lyren AI
Templates and checklists to speed mapping work
SIPOC template
- Supplier: [Who supplies input?]
- Input: [What input is required?]
- Process: [High-level steps]
- Output: [What the process produces]
- Customer: [Who receives the output?]
Basic mapping checklist
- Scope defined and agreed
- Owner assigned
- Event logs collected and cleaned
- At least 3 real cases traced
- Swimlanes for roles included
- Decision points and criteria documented
- Exception paths mapped
- Metrics per step added
- Automation candidates highlighted
- Linked SOPs and training materials
RACI mini-template
- R: Responsible (does the work)
- A: Accountable (signs off)
- C: Consulted (offers input)
- I: Informed (keeps updated)
Include in mapping:
- Name the role next to each activity
- Document escalation path for each decision
Quick automation candidate filter
- Repeatability: Task happens >50 times/month
- Rule-based: Decisions are binary or deterministic
- Low exception rate: Exceptions <20% to start with
- Data availability: Inputs are in logs or APIs
- ROI: Estimated time saved * frequency > cost of automation
From Mapping to Automation: KPIs and Implementation Readiness
Mapping without metrics is decoration. Here's how to measure and move to automation.
How to use maps to identify automation candidates and RPA opportunities
- Mark tasks that are manual, repeatable, and rule-based. These are low-friction RPA candidates.
- Use event logs to quantify time spent per activity. If step X takes 10 minutes and happens 10,000 times/year, that's 1,667 hours — ripe for automation.
- Assess technical feasibility: Can the task be done through APIs or UI automation? Prefer APIs; UI automation is brittle.
- Avoid automating broken processes. Fix the process first — reduce exceptions and clarify decisions before automating.
Example: invoice processing
- Manual steps: data entry from PDF to ERP, invoice matching, and exception handling.
- Mapping reveals 70% of invoices are exact matches and follow a rule-based path. Automate the matching and data entry; route exceptions to a human queue.
- Result: 80% of invoices processed automatically, 60% reduction in processing time.
Key metrics and KPIs to measure process health and improvement impact
Operational KPIs
- Cycle time: time from process start to completion.
- Lead time: time from customer request to delivery.
- Throughput: number of completed cases per period.
- First Pass Yield (FPY): percent completed without rework.
- Defect rate: number of defects per 1,000 transactions.
- Handoff time: average wait between role A completing and role B starting.
Business KPIs
- Cost per case: total cost divided by throughput.
- Customer satisfaction (CSAT / NPS) for customer-facing flows.
- SLA compliance rate: percent of cases meeting agreed SLAs.
How to set targets
- Use baseline measurements from your event logs.
- Aim for realistic incremental improvements: 10% cycle-time reduction in the first quarter, 30% in the first year for targeted processes.
Example KPI dashboard items for a release pipeline
- Mean time to deploy (hours)
- Build success rate (%)
- Deployment rollback rate (%)
- Lead time for changes (days)
- Number of manual approvals in pipeline
Roadmap: mapping → pilot → scale → continuous monitoring
- Map and baseline (2–4 weeks)
- Discover, map, and measure current state.
- Identify quick wins (1–2 weeks)
- Small process fixes, template updates, or removal of redundant steps.
- Pilot automation (4–8 weeks)
- Pick a low-risk, high-value process. Create test cases and rollback plan.
- Evaluate and iterate (2–4 weeks)
- Measure KPIs, capture exceptions, refine.
- Scale (3–6 months)
- Expand automation to similar processes, add governance.
- Continuous monitoring
- Use dashboards and process mining to detect drift and regressions.
Real-world timeline example: onboarding automation
- Week 0–2: Map onboarding steps for a customer onboarding flow.
- Week 3–4: Clean data and identify that 60% of steps are form fills suitable for automation.
- Week 5–10: Build and pilot an automation that fills forms and triggers account creation.
- Week 11–14: Measure and expand to cover payment processing and verification.
Monitoring tools
- Use a combination of APM/observability (Datadog, New Relic), process mining (Celonis), and internal dashboards (Grafana) to keep an eye on process health.
- Automations should emit audit events so you can trace failures back to the process map.
Conclusion
Software process mapping isn't a checkbox exercise. It's the bridge between vague tribal knowledge and predictable, measurable delivery. Do it right and you'll cut cycle times, reduce defects, and find safe automation opportunities. Start small: map a high-frequency, high-impact process, run a short workshop, and pair the map with 3–5 KPIs. Then use tools — process mining for reality checks, Lucidchart or Signavio for diagrams, and Lyren AI to extract step-by-step documentation and UI-based flow diagrams from screen recordings.
Actionable next steps
- Run a 60-minute map sprint: pick a process, invite 3 people, and sketch the high-level flow in Miro or on a whiteboard.
- Pull an event log from your ticketing or CI system and run Disco or Celonis to see the real variants.
- Try automating one repetitive manual step with an API-first approach. Measure time saved and exception rate.
- Use Lyren AI on one onboarding video or screen recording to generate a step-by-step SOP and a process diagram; compare it to your current map.
Templates to try right now
- SIPOC for process kickoff
- 1-page RACI for ownership
- Mapping checklist to keep your work consistent
Further reading and tools to explore
- Pick one process mining tool (Disco, Celonis, UiPath Process Mining) and run a 2-week proof of value.
- Try Signavio or Camunda if you need BPMN and policy control.
- Use Lyren AI to convert screen recordings into documentation and diagrams — especially useful for capturing UI-driven steps you never wrote down.
Maps alone won't fix everything. But they make problems visible and give you a reliable path to better processes, safer automation, and measurable business value. Start mapping, measure relentlessly, and focus on the smallest change that yields the biggest outcome.