Process Mapping Software: Choose, Implement & Optimize for ROI
Introduction
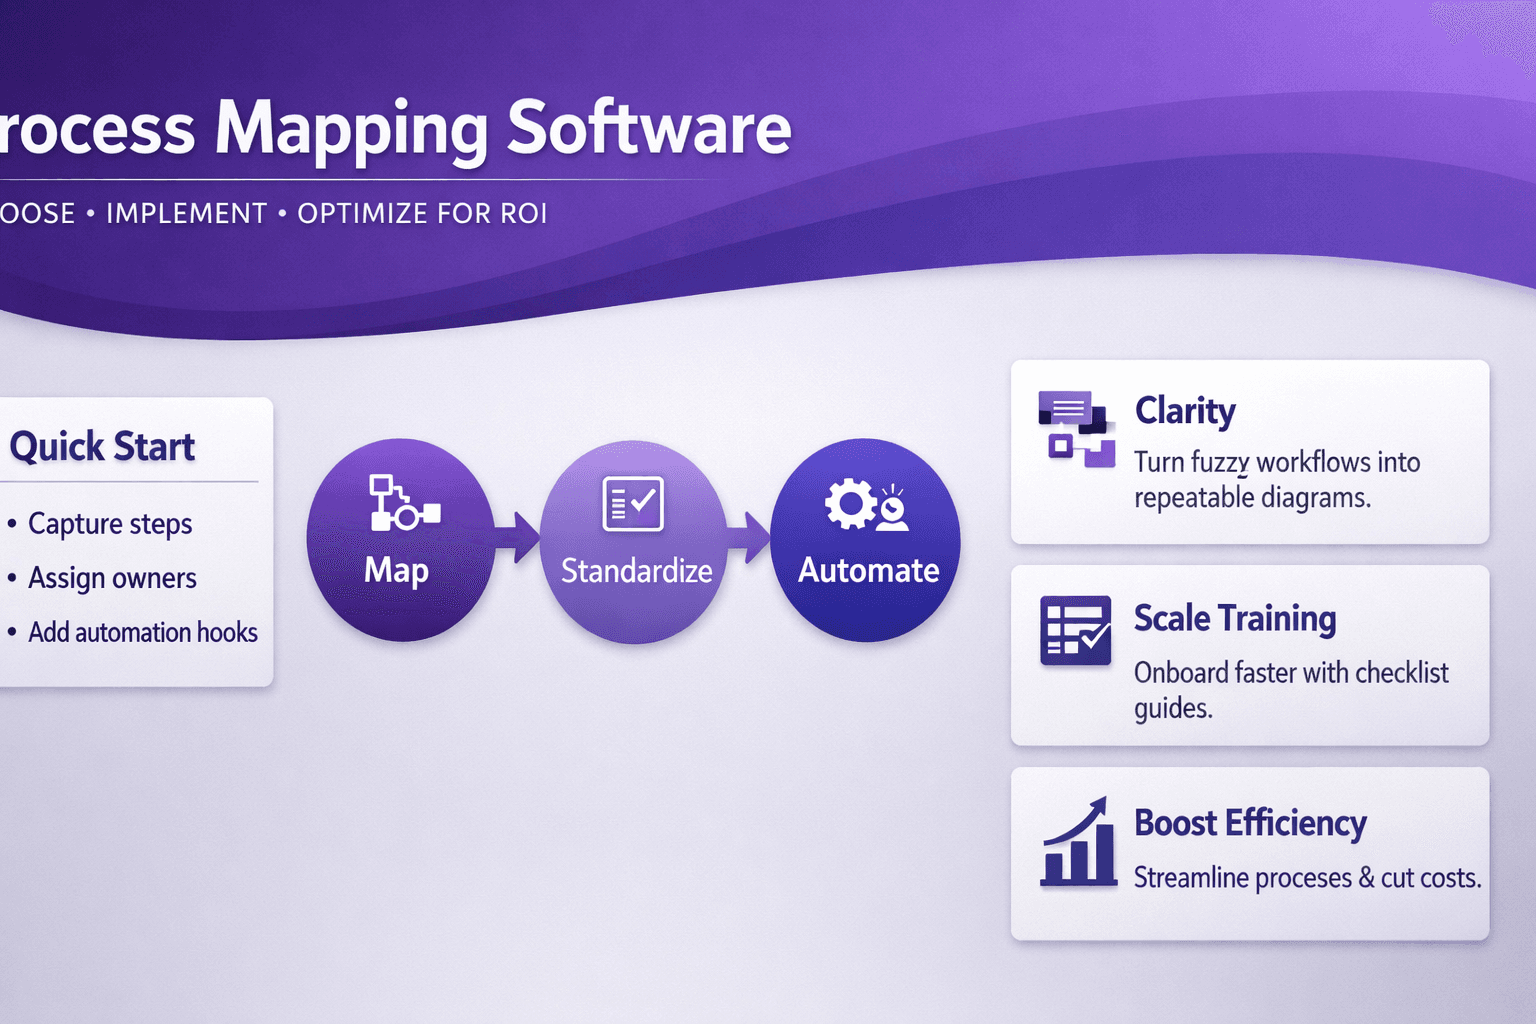
Process mapping software helps teams turn fuzzy, oral workflows into clear, repeatable diagrams and living documentation. Think of it as the difference between someone telling you "send the invoice" and handing you a checklist with screenshots, responsibilities and automation hooks. For business analysts, consultants and operations managers, that clarity isn't a nice-to-have — it's how you cut waste, scale training, and get automation projects to actually pay off.
This guide covers what process mapping software does, which features matter, who benefits most, how to pick vendors, how to roll a solution out without chaos, and how to measure ROI so your CFO stops asking why you bought another diagramming tool. I’ll give real examples, trial tactics, and a practical checklist you can use to pilot a tool in the next 30 days.
What Is Process Mapping Software and How It Works
At its core, process mapping software is a toolset for capturing, documenting and visualizing end-to-end processes. That sounds simple, but the right software goes beyond boxes and arrows.
Core capabilities you can expect:
- Flowcharting: draggable shapes, swimlanes and connectors for basic diagrams.
- Swimlanes: assign activities to roles, teams, or systems visually.
- BPMN support: Business Process Model and Notation for detailed modeling.
- Versioning: save history and rollback changes.
- Collaboration: comments, live co-editing and approvals.
- Simulation and analytics: run “what-if” scenarios and measure bottlenecks.
How it typically works:
- Capture — import a recording, interview SME, or record a screen session (Lyren AI and tools like Camunda or UiPath Process Mining can auto-extract steps from UI videos).
- Structure — add roles, inputs, outputs and decision points.
- Validate — review with stakeholders and iterate.
- Publish — produce PDFs, SOPs, training decks or machine-readable exports (BPMN XML).
- Act — hand off to RPA, automation engineers, or training teams.
Difference between diagram tools and mapping platforms
- Diagram tools (Visio, Lucidchart, Miro) are great for one-off visuals and brainstorming. They lack built-in process repositories, governance, or automation connectors.
- Purpose-built mapping platforms (SAP Signavio, Camunda, Appian, ARIS, Bizagi) include process repositories, governance, simulation, and integrations to automate or feed RPA. They'll also track metrics over time.
Pick Visio if you need occasional diagrams. Pick a mapping platform when processes are a measurable asset — when you want repeatable SOPs, automation-ready artifacts, and audit trails.
Key Features to Look For
Not all features matter equally. Below are the ones that move the needle.
Collaboration and real-time editing for distributed teams
- Real-time co-editing and comments (like Google Docs for processes) reduce review cycles. Look for simultaneous edits, presence indicators, and threaded comments.
- Example: a distributed banking team used Lucidchart initially, but switched to Signavio for role-based reviews and approvals — review cycles dropped from two weeks to four days.
Integration with process repositories, RPA, and ERP/CRM systems
- Top tools connect to UiPath, Automation Anywhere, Blue Prism, Salesforce and SAP. That makes maps actionable.
- Check whether the tool can export BPMN XML (for Camunda or Appian) and provide metadata (forms, variables) your automation platform needs.
Advanced modeling: BPMN, SIPOC, value stream mapping and simulation
- BPMN is the standard for automation handoffs — a must for RPA and workflow engines.
- SIPOC and VSM are useful for process improvement and Lean work.
- Simulation helps estimate the impact of changes (e.g., reducing approval time by 50% cuts cycle time from 7 to 4 days).
Version control, audit trails and role-based access
- Audit trails matter for compliance (finance, healthcare). You want to see who changed a step and why.
- Role-based access prevents accidental edits and controls who can publish vs. draft.
Reporting, analytics and export options for stakeholders
- Look for dashboards with cycle time, rework rate and handoff delays.
- Export options: PDF for executives, HTML/SOP packages for trainers, BPMN XML for automation engineers.
Practical tip: prioritize the integrations your team actually uses. If 60% of work sits in Salesforce, integration there is more valuable than fancy simulation that nobody runs.
Use Cases and Who Benefits Most
Process mapping software is not one-size-fits-all. These are the common, high-payoff scenarios.
Business process improvement and waste reduction (Lean/Six Sigma)
- Use mapping to spot non-value activities. Example: a retail logistics team found 12% of order checks duplicated across systems; mapping eliminated duplicate steps and cut processing cost by 8%.
- Value stream mapping clarifies throughput and inventory points; combine with cycle time metrics and you get actionable targets.
RPA and automation-ready process discovery
- Automation teams need reliable, repeatable processes. Tools that can extract steps from screen recordings (Lyren AI does this) speed process discovery and produce RPA-ready artifacts.
- Example: a finance team used screen recordings to get 95% accurate step extraction, reducing discovery time from 30 hours to 6 hours per process.
Change management, training and standard operating procedures
- Process maps become living SOPs. Add screenshots, video clips and step-level instructions for new hires.
- Example: a hospital used a mapping platform to create procedure docs with embedded video, cutting onboarding time for nurses by 20%.
Consulting engagements: discovery, proposal, and transformation roadmaps
- Consultants use maps for client discovery, gap analysis and roadmaps. Deliverables become evidence-based, not anecdotal.
- A consultant pitched a process improvement project with mapped current-state and simulated future-state; the client approved a $250k project based on projected ROI.
Who benefits most?
- Business analysts and process owners — they get clarity and control.
- Automation engineers and RPA teams — they get executable maps and reduced discovery time.
- Training teams and HR — they get consistent SOPs and measurable onboarding improvements.
- Executives — they get measurable KPIs and better-informed investment decisions.
How to Evaluate and Compare Vendors
Buying process mapping software isn't just a feature check — it's deciding what process maturity looks like for your org.
Assessment criteria: features, scalability, security, and APIs
- Features: BPMN export, simulation, repository, screen recording import.
- Scalability: Can the platform handle 10,000 diagrams and 500 concurrent editors? Ask for real customer scale numbers.
- Security: SSO (SAML), data residency, SOC 2 type II compliance, encryption at rest and in transit.
- APIs: Look for REST APIs and Webhooks to integrate with your lifecycle tools (Jira, Git, ServiceNow).
Price models: per-user, per-seat, enterprise licensing and hidden costs
- Per-user license (Visio/Lucidchart): cheap to start, expensive for large teams.
- Per-seat or concurrent-user (enterprise tools): common for large orgs.
- Enterprise licensing with modules: vendor might charge extra for simulation, RPA connectors or audit logs.
- Hidden costs: implementation services, training, migration of legacy process docs, and ongoing admin overhead.
- Example: An org buying Signavio for 200 users reported paying 30% of license cost on initial services and templates; budget for that.
Trial strategies: pilot projects, proof-of-concept scenarios and checklists
- Don’t just test features — run a pilot on a real process.
- Pilot checklist:
- Pick a high-impact process (accounts payable, lead-to-cash).
- Record a 30–60 minute session (screen + SME narration).
- Import into tool and build mapping artifacts.
- Export BPMN and hand to automation engineers.
- Measure time to create artifacts and stakeholder satisfaction.
- Look for speed of capture, accuracy of exports, and ease of stakeholder review.
Vendor support, community, and roadmap alignment with your needs
- Support: SLAs, success manager, and training options.
- Community: active user forum, templates gallery, third-party consultants.
- Roadmap: does the vendor plan features you’ll need (process mining, AI-assisted mapping)? Ask for roadmap alignment with your use case.
Practical vendor shortlist method:
- Create a 2-page scoring matrix: must-haves (BPMN export, SSO), nice-to-haves (simulation), deal-breakers (no API).
- Score vendors 0-5 on each, weight must-haves higher, and shortlist top two for a 30-day pilot.
Implementation Best Practices
Buying the software is the easy part. Making it useful is where you win or fail.
Preparing stakeholders and defining governance for process documentation
- Start with roles: who owns a process, who can edit, who approves.
- Create a governance charter with versioning rules and retention policies.
- Example: One ops team created a "Process Owner" role responsible for quarterly reviews — helped keep maps current.
Phased rollout: pilot, scale, and continuous improvement loops
- Pilot (0–3 months): single, high-value process; collect feedback and measure time to value.
- Scale (3–12 months): train a dozen power users, create templates, and expand to critical departments.
- Continuous improvement (ongoing): review cadence, KPIs, and a backlog of process updates.
Training programs, templates and center-of-excellence setup
- Training: run hands-on sessions, not just slides. Teach people how to capture real processes (SME interviews, screen recordings).
- Templates: start with 3 templates — SOP, RPA-ready BPMN, training checklist.
- Center of Excellence (CoE): 2–4 people to run governance, templates, and train new users. CoE also curates process libraries and measures adoption.
Common pitfalls to avoid and tips to accelerate adoption
- Pitfall: "We’ll trust SMEs to document processes." Reality: SMEs forget steps and skip exceptions.
- Tip: use screen recordings and task mining where possible; structured capture beats memory.
- Pitfall: Over-modeling. Teams try to make every decision node perfect.
- Tip: aim for "fit-for-purpose" detail. For automation, you need precise steps; for training, screenshots and responsibilities suffice.
- Pitfall: No ownership. Maps drift.
- Tip: attach SLA to process owner: e.g., review every 90 days, or after a change in a critical system.
- Pitfall: Tool complexity. Fancy features aren’t useful if users avoid the tool.
- Tip: pick a simple workflow for pilots and expand features gradually.
Quick adoption hacks
- Embed process links in Jira tickets, LMS courses, and Slack channels so people see maps in context.
- Reward power users with recognition or small budget for training.
- Provide a one-click export to PDF/SOP for executives who don’t use the platform.
Measuring ROI and Success Metrics
You need numbers that matter. Here’s how to measure and prove value.
Quantitative KPIs
- Cycle time: measure before/after (e.g., average time to approve invoice drops from 6 days to 3 days).
- Error rates: track rework or correction rates (example: invoice matching errors reduced from 4% to 1.5%).
- Cost-per-transaction: calculate labor cost per transaction; automation and clearer SOPs lower this over time.
- Throughput: transactions per day/week; maps and automation often increase throughput.
- Discovery time reduction: hours to document a process (screen-recording tools can cut discovery from 30 hrs to 6 hrs — huge time savings).
Set a baseline, then measure at 30, 90 and 180 days. Use small wins to justify further investment.
Qualitative benefits
- Knowledge retention: fewer single-person dependencies.
- Compliance: audit readiness with trails and version history.
- Stakeholder buy-in: faster decision-making when everyone agrees on “how it works”.
Attributing automation value: linking maps to RPA and process execution
- Build traceability: map -> BPMN export -> automation workflow -> execution logs.
- Example: If an automation handles 3,000 invoices/month and cost per manual invoice was $2.50, automation reduces cost by $7,500/month. Tie that back to the map that made automation possible.
- Use process mining (Celonis, UiPath Process Mining) to confirm that execution matches the map, and to identify exceptions.
Dashboarding and periodic review cadence for sustained gains
- Create an operations dashboard with KPIs per process: cycle time, exceptions, owner, last review date.
- Review cadence:
- Weekly: critical process exceptions.
- Monthly: KPI trends and automation impact.
- Quarterly: process owner reviews and updates.
- Example: a telecom company saved $1.2M annually by reviewing top 25 processes quarterly and automating the top 5.
Conclusion
Process mapping software turns undocumented chaos into structured, measurable assets. When you pick the right tool, plan a realistic pilot, and measure the outcomes, you get faster onboarding, fewer errors, and automation projects that actually deliver.
Short checklist to select and pilot a solution
- Pick a high-impact process (e.g., accounts payable, lead-to-cash).
- Define success metrics (cycle time, error rate, cost-per-transaction).
- Require BPMN export and at least one RPA integration in the vendor checklist.
- Run a 30-day pilot: record the process, import, validate with SMEs, export for automation.
- Measure time to deliver artifacts and initial KPI changes at 30/90 days.
- Set up governance: process owner, review cadence, and CoE.
Resources for further reading, templates and vendor comparison tips
- Search for vendor names and sample use cases: SAP Signavio, Camunda, ARIS, Bizagi, Appian, UiPath Process Mining, Celonis, Microsoft Visio, Lucidchart, Miro.
- Look for BPMN 2.0 tutorials and sample BPMN XML to understand what automation teams need.
- Use trial strategies above on two shortlisted vendors and compare: time-to-capture, ease-of-export, collaboration features, and hidden costs for services.
Example process capture template (copy into your tool)
process_name: "Invoice Processing - AP"
owner: "AP Manager"
last_reviewed: "2026-01-01"
objective: "Match and approve supplier invoices within 72 hours"
steps:
  - id: 1
    name: "Receive invoice (email/portal)"
    role: "AP Clerk"
    system: "SAP"
    time_estimate_minutes: 10
    screenshot: "step1.png"
  - id: 2
    name: "Validate PO & goods receipt"
    role: "AP Clerk"
    system: "SAP"
    time_estimate_minutes: 15
    exceptions: ["No PO found", "Qty mismatch"]
  - id: 3
    name: "Approve or route to manager"
    role: "AP Manager"
    system: "ApprovalApp"
    time_estimate_minutes: 30
metrics:
  baseline_cycle_time_days: 6
  target_cycle_time_days: 3
notes: "Attach BPMN XML and RPA variables on export"
A final thought: tools matter, but good habits matter more. Commit to ownership, simple templates, and a short review cycle. If you do that, process mapping software becomes a multiplier — not another expensive shelfware item.
If you want a process that’s already partly captured via screen recordings and turned into structured docs and flow diagrams, look for platforms that extract steps from videos and offer an AI assistant to answer process questions — that’s where discovery time shrinks and automation projects accelerate.