Business Process Mapping Software: Choose, Implement, and Optimize
Introduction
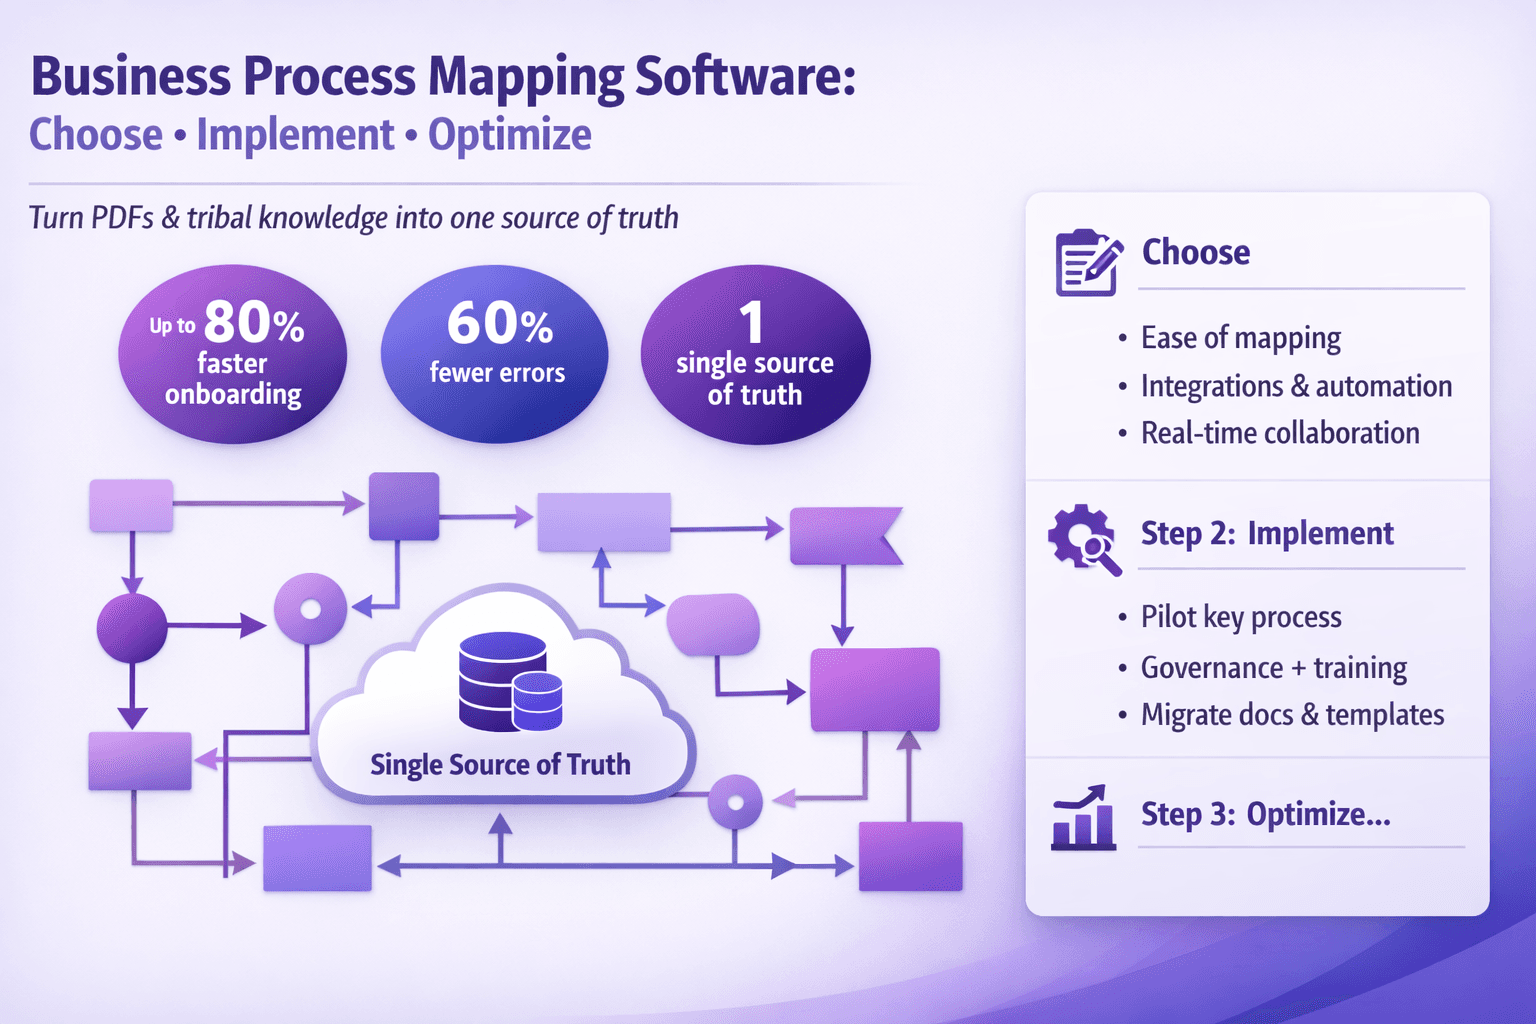
If your team still keeps process knowledge locked in PDFs, headless Google Docs, or — worse — people’s heads, you'll drag on speed and quality. Business process mapping software is the tool that forces clarity: it helps you capture how work actually happens, spot the ugly handoffs, and create a single source of truth for training, audits, and automation.
This article is for business analysts, consultants, operations leads, and tech folks who need to pick, implement, and get value from process mapping tools. You’ll walk away with a practical evaluation checklist, step-by-step implementation advice, real-world examples, and quick ROI math you can show your boss.
What you’ll learn:
- How to evaluate business process mapping software for documentation, process mining, and automation.
- Which features matter and why — with examples from tools like Lucidchart, Signavio, Camunda, Celonis, UiPath, and Lyren AI.
- A practical pilot plan, governance ideas, and adoption tactics that actually work.
- How to measure ROI: numbers, KPIs, and sample calculations.
If you want to turn chaotic procedures into consistent work that can be automated, trained on, and measured — read on.
Why Use Business Process Mapping Software
Let’s be blunt: vague processes cost money. A single missed approval, a duplicated manual step, or a misunderstanding between Sales and Finance can ripple for weeks. Good process mapping software does four big things.
Visualize end-to-end processes to expose gaps, redundancies, and bottlenecks
Draw a process and problems jump out. When you map a sales-to-cash flow — lead capture, quote, order, billing — you might find redundant approvals in finance and sales duplicating checks. Visuals help reveal:
- Bottlenecks: where queues grow (e.g., an approvals queue with average wait time 48 hours).
- Redundant steps: two systems requiring the same customer data entry.
- Hidden rework: users fixing incorrect data because a validation step is missing.
Example: a mid-sized SaaS company mapped their onboarding flow and cut customer setup time from 10 days to 3 days after removing a manual email confirmation stage.
Standardize documentation for compliance, training, and continuous improvement
Regulated teams — finance, HR, healthcare — need consistent SOPs. Process maps are easier to follow than long text documents. When combined with screen recordings and step-by-step screenshots, maps become training-friendly SOPs.
Lyren AI, for example, turns UI videos into structured documentation and flow diagrams automatically. That’s gold when you want a new hire to do the exact steps in a billing system like NetSuite or SAP.
Enable cross-team collaboration and faster process handoffs
A process map creates shared language. That reduces the "that’s not my job" handoff problem. Use comments, version control, and role-based access so teams can suggest changes without breaking the source of truth.
Real example: A logistics firm used Miro for initial mapping and then moved final maps into Signavio for governance. The result: 30% fewer handoff disputes and clearer SLAs between Warehouse and Customer Support.
Create a foundation for automation, process mining, and performance tracking
If you're planning RPA, workflow automation, or process mining, maps are the blueprint. You can only automate what you've clearly defined. And with process mining tools like Celonis or UiPath Process Mining, you validate your models against event logs so automation is pointed at real bottlenecks.
A practical sequence: map first -> capture event logs -> run process mining -> refine maps -> create automations in UiPath or Power Automate.
Core Features to Look For
Not all process mapping tools are built the same. Some are diagram-first, others are analysis-first, and a few (like Lyren AI) focus on extracting processes from videos and building documentation automatically. Here are the features I care about and why.
Intuitive diagramming and reusable templates
Must-haves:
- Drag-and-drop diagramming with BPMN 2.0 support (if you want technical accuracy).
- Reusable templates for common processes: hire-to-retire, procure-to-pay, order-to-cash.
- Auto-layout and quick formatting so maps don’t become ugly.
Why BPMN? If your developers or RPA team need to read the model, BPMN is unambiguous. If your audience is purely business, simpler flowcharts (Visio-style) may be better.
Tools with strong diagramming: Lucidchart, Microsoft Visio, Miro for whiteboarding, and Signavio for enterprise BPMN.
Collaboration, commenting, version control, and role-based access
You’ll need:
- Real-time collaboration (so BA and process owner can edit together).
- Comment threads on shapes.
- Version history with the ability to revert.
- Role-based access and approval workflows for governed processes.
Example: In Signavio, you can move a process through review states (draft > review > approved) which helps with audits.
Process analysis tools: simulation, bottleneck detection, and metrics
Useful advanced features:
- Simulation (run "what-if" scenarios on cycle times and resources).
- Bottleneck/highlight analysis using process mining or built-in cycle-time metrics.
- Custom metrics and KPIs tied to process steps.
Example: Camunda or Bizagi allow simulation of throughput under different staffing levels — handy for capacity planning.
Integration/export options and reporting dashboards
You want maps to talk to other systems:
- Export to Visio, BPMN XML, CSV.
- API access for syncing with CMDB, ERPs, or documentation platforms.
- Built-in dashboards or integrations with Power BI/Tableau for reporting.
Lyren AI’s ability to take UI videos and output step-by-step docs plus flow diagrams becomes useful here: you can export the diagrams and link them to a knowledge base.
Security, audit logs, and enterprise governance capabilities
At minimum:
- SSO (SAML/Okta), role-based permissions, encryption at rest.
- Audit logs for changes and approvals.
- Multi-tenant support if you need departmental isolation.
Large organizations need enterprise governance so process owners can't accidentally overwrite approved SOPs.
How to Choose the Right Tool (Evaluation Checklist)
Choosing the wrong tool wastes months. Here's a checklist you can run through during vendor demos or trials.
-
Fit with your use cases
- Documentation-first? Pick tools with easy diagramming and content export (Lucidchart, Lyren AI).
- Automation readiness? Choose tools that produce BPMN or integrate directly with RPA/workflow engines (Camunda, Signavio).
- Process mining? Look at Celonis or UiPath Process Mining for discovery and validation.
-
Usability for business users vs. advanced modeling
- Test with a non-technical user and an analyst. Does the non-technical user get stuck on BPMN complexity?
- Many orgs keep two tools: a lightweight diagram tool for business teams and an analyst tool for power users.
-
Integration needs with ERP, CRM, RPA, and data systems
- Map your systems (Salesforce, SAP, Oracle, ServiceNow). Does the tool have connectors? If not, can you use APIs?
- Example integration question: "Can I push process metadata to an RPA orchestrator or pull event logs from Salesforce?"
-
Scalability, deployment model, and vendor support
- Will this be used globally across 500 users or just a 10-person team?
- Decide cloud vs. on-premise. Regulated environments often need on-prem or VPC options.
- Ask about SLAs, onboarding support, and community resources.
-
Pricing model, total cost of ownership, and trial/pilot options
- Pricing types: per-user/month, per-seat, per-process, or enterprise flat fee.
- Ask for hidden costs: integration engineering, training, or custom governance.
- Get a 30-day trial or a funded pilot. Lyren AI offers a 7-day free trial — enough to test a couple of processes and validate extraction of UI steps.
Bonus: create a scoring matrix. List features on rows and vendors in columns. Score 1–5 and weight items by importance (e.g., integrations 30%, usability 25%, cost 15%).
Implementation and Adoption Best Practices
Buying a tool is easy. Getting teams to use it and extracting value is the hard part. Here’s a practical rollout path I’ve used with clients.
Start with a pilot: map a high-value process to demonstrate ROI
Pick a process with clear pain, measurable outcomes, and a willing process owner. Examples:
- Purchase order approvals causing a 5-day lead time.
- Employee onboarding with high new-hire support tickets.
- Claims processing in insurance with high error rates.
Pilot steps (6-8 weeks):
- Select process and sponsor.
- Record current state using screen recordings and interviews.
- Map current state in the tool (use Lyren AI to auto-extract UI steps if you have training videos).
- Run a mini process mining (if logs exist) or collect cycle-time samples.
- Propose changes, simulate if possible, and implement a small automation or rule change.
- Measure improvement in cycle time, error rate, or rework.
Example outcome: a pilot reducing approval time from 72 hours to 18 hours by removing a duplicate check and adding a form validation rule. That’s a 75% reduction.
Establish process governance, standards, and a central repository
Governance elements:
- Naming conventions: department.process.name.version
- Ownership model: process owner, process steward, process editor
- Approval workflow for map changes
- Central repository (Confluence, SharePoint, Lyren AI KB) with direct links to maps and SOPs
Make the repository the single source of truth. No more "I have a newer version in my local drive" nonsense.
Train stakeholders and create role-based onboarding materials
Don’t run a one-size-fits-all training:
- Create 15–30 minute role-specific onboarding (approvers, editors, viewers).
- Use screen recordings and step-by-step guides. Lyren AI can turn those recordings into searchable SOPs with diagrams — perfect for self-service training.
- Offer office hours for the first 60 days.
Pro tip: record your training sessions and add them to the knowledge base so new joiners can access on-demand material.
Measure success with KPIs and iterate
Select 3–5 KPIs per process:
- Cycle time
- Error rates / rework instances
- Throughput (transactions per day)
- Compliance rate (charts vs. audit results)
- Training time for new hires
Set baseline metrics before changes. Then measure weekly for the first quarter and adjust.
Use change management tactics to drive adoption across teams
Change management is simple and rarely done well. Use these tactics:
- Executive sponsor with visible support.
- Champions in each team who get small incentives to drive adoption.
- Quick wins spotlight: monthly emails showing time saved or fewer tickets.
- Mandate updates in performance plans for process owners if you want sustained change.
An ops director I worked with had a KPI where process owners had to publish one process improvement per quarter to be eligible for a small bonus. It worked — process quality improved quickly.
Integrations, Automation, and Advanced Use Cases
Once maps exist and people trust them, you can do interesting stuff.
Connect maps to RPA, workflow engines, and low-code platforms
Take the repetitive, rule-based work and push it into RPA or workflows:
- Identify steps with high manual effort and low decision complexity.
- Export BPMN or a clear checklist for developers.
- Tools and examples:
- UiPath + documented maps for invoice processing
- Power Automate flows kicked off from approval decisions in the map
- Camunda for workflows requiring human tasks and integrated APIs
Example: A finance team used Lucidchart diagrams as the spec for UiPath developers, cutting manual invoice processing headcount by 40% and cutting exceptions by 30% after adding data validation and an automated matching rule.
Use process mining and analytics to discover gaps and validate models
Process mining tools read event logs and show the real paths people take. That often looks different from the "ideal" map.
Workflow:
- Pull event logs from SAP, Salesforce, or SQL tables.
- Run process discovery in Celonis or UiPath Process Mining.
- Compare discovered paths to your documented process.
- Fix mismatches: either update the map or change behavior.
Remember: log quality matters. If your system timestamps are messy, mining will be noisy.
Integrate with ERPs, CRMs, BI tools, and data lakes for end-to-end insights
Connect process metadata and performance metrics to BI tools:
- Export metrics to Power BI or Tableau.
- Join process KPIs with customer, product, or financial data in a data lake.
- Create dashboards with drill-downs from the process map to real transactions.
Example: Merge order-to-cash cycle time with customer churn data to see if slow fulfillment correlates with churn.
Support continuous improvement with automated monitoring and alerts
Don’t let maps sit idle. Automate monitoring:
- Alerts when cycle time spikes beyond threshold.
- Notifications when approved process docs haven’t been reviewed in 12 months.
- Scheduled audits with checklists triggered by the mapping tool.
Real setup: Use an API to send process metrics to Slack or Teams when a KPI is missed. That keeps process owners in the loop.
Case Studies, ROI, and Quick Wins
Numbers sell. So here are concrete examples and how to calculate expected ROI.
Example 1: Reducing approval cycle time with mapped workflows and automation
Scenario:
- A legal contract approval process averaged 72 hours (3 days).
- 100 contracts processed per month.
- Avg employee cost $40/hour.
Problem:
- 60% of the time was waiting for manual signature routing. Human errors caused 10% to return for clarification.
Intervention:
- Map the process, remove duplicate approvals, add form validations, and implement a simple automated routing using Power Automate.
Outcome (after changes):
- Cycle time down to 18 hours (75% reduction).
- Error rate reduced from 10% to 4%.
- Time saved: 54 hours per contract per month across 100 contracts = 5,400 hours saved monthly? Wait — this needs correct math.
Corrected math:
- Old total hours in process per month = 72 hours * 100 = 7,200 hours.
- New total hours per month = 18 * 100 = 1,800 hours.
- Hours reduced = 5,400 hours per month. That's the theoretical elapsed time saved; human effort saved may be smaller because automation mainly reduces wait time, not active work.
If we assume active work was 20% of elapsed time before (common in approval processes), previously 7,200 * 20% = 1,440 active hours per month. After automation, active hours drop to 1,800 * 20% = 360 hours. Active hours saved = 1,080 hours/month. Multiply by $40/hr = $43,200/month saved. That’s a quick payback.
You see the point: clarify what you're measuring (elapsed cycle vs. active human effort), and pick assumptions that reflect reality.
Example 2: Improving compliance and audit readiness with standardized maps
Scenario:
- A healthcare org faced quarterly audits. Each audit took 40 person-hours to compile evidence across teams.
- Audits cost roughly $200/hour in internal labor and consultants.
Intervention:
- Build a governed process repository with approved maps and linked evidence (screenshots, SOPs).
- Use automated evidence collectors (scripts or Lyren AI generated documentation) to gather screenshots of system states.
Outcome:
- Audit prep time dropped to 8 hours.
- Monthly savings: (40 - 8) * $200 = $6,400 per audit cycle.
Plus, less risk of non-compliance penalties. That’s actual risk reduction value.
How to calculate ROI: time savings, error reduction, and resource reallocation
Simple ROI framework:
- Baseline current cost = (active hours per month * hourly rate) + cost of errors (rework, penalties).
- Implement change: estimate reduced active hours and fewer errors.
- Annualize savings and compare to total cost of tool + implementation.
Example calculation:
- Baseline: 1,200 active hours/month * $50/hr = $60,000/month = $720,000/year.
- After changes: 800 hours/month * $50 = $40,000/month = $480,000/year.
- Annual labor savings = $240,000.
- Tool + implementation cost = $60,000/year.
- Net annual benefit = $180,000. ROI = 300% simple payback.
Always include conservative and optimistic scenarios and capture intangible benefits (faster onboarding, reduced customer churn).
Quick wins to pursue first
If you want wins inside 60 days, try these:
- High-volume manual handoffs (e.g., purchase requisition approvals).
- Processes with frequent errors (finance reconciliation, data entry).
- Onboarding flows where training time is long.
- Audit-heavy processes with lots of evidence collection.
Pilot these so you can show results fast and then scale.
Practical Tools and Examples
Here’s a shortlist of real-world tools and when to use them together.
- Lucidchart: Great for fast diagrams and collaboration across business teams. Use for initial discovery and stakeholder workshops.
- Microsoft Visio: Standard in many enterprises. Use when integration with Office/SharePoint matters.
- Signavio (SAP Signavio): Strong governance, process repository, and BPMN modeling for enterprise-level process management.
- Camunda: If you want to build executable BPMN workflows and integrate with microservices.
- Celonis: For process mining and discovery from event logs.
- UiPath / Automation Anywhere / Power Automate: RPA and low-code automation engines to act on mapped processes.
- Lyren AI: If you have screen recordings or onboarding videos, Lyren AI can extract step-by-step documentation and generate flow diagrams — cuts documentation time drastically and keeps SOPs in sync with UI changes.
Integration example — simple webhook to send approved process metadata to an RPA queue:
POST /api/processes/approved
Content-Type: application/json
Authorization: Bearer <token>

{
  "process_id": "PO-APPROVAL-001",
  "name": "Purchase Order Approval",
  "version": "1.2",
  "trigger": "purchase_request_submitted",
  "owner": "finance.ops@example.com",
  "bpmn_xml_url": "https://kb.example.com/processes/PO-APPROVAL-001/bpmn"
}
RPA orchestrator receives the webhook and enqueues a job for process automation. Small, but effective.
Conclusion
The right business process mapping software gives you visibility, consistency, and the stepping stones to automation. Don’t buy on demos alone: pilot a real process, measure hard metrics, and build governance so your maps stay accurate. Use tools that fit your users — simple diagramming for frontline teams, BPMN and process mining for analysts and automation engineers.
Quick steps to take now:
- Run a pilot on a high-volume process and capture baseline KPIs.
- Use the evaluation checklist to compare vendors against your integration and governance needs.
- Add screen recordings and structured documentation (Lyren AI can help convert UI videos to SOPs and flow diagrams).
- Measure improvements and standardize the governance model before scaling.
Pick a process, pick a tool, and start mapping. The first few maps will be imperfect. That’s okay. Process clarity compounds fast, and the savings show up in weeks, not years.