Automated Process Mapping Software: Boost Efficiency & Reduce Errors
Introduction
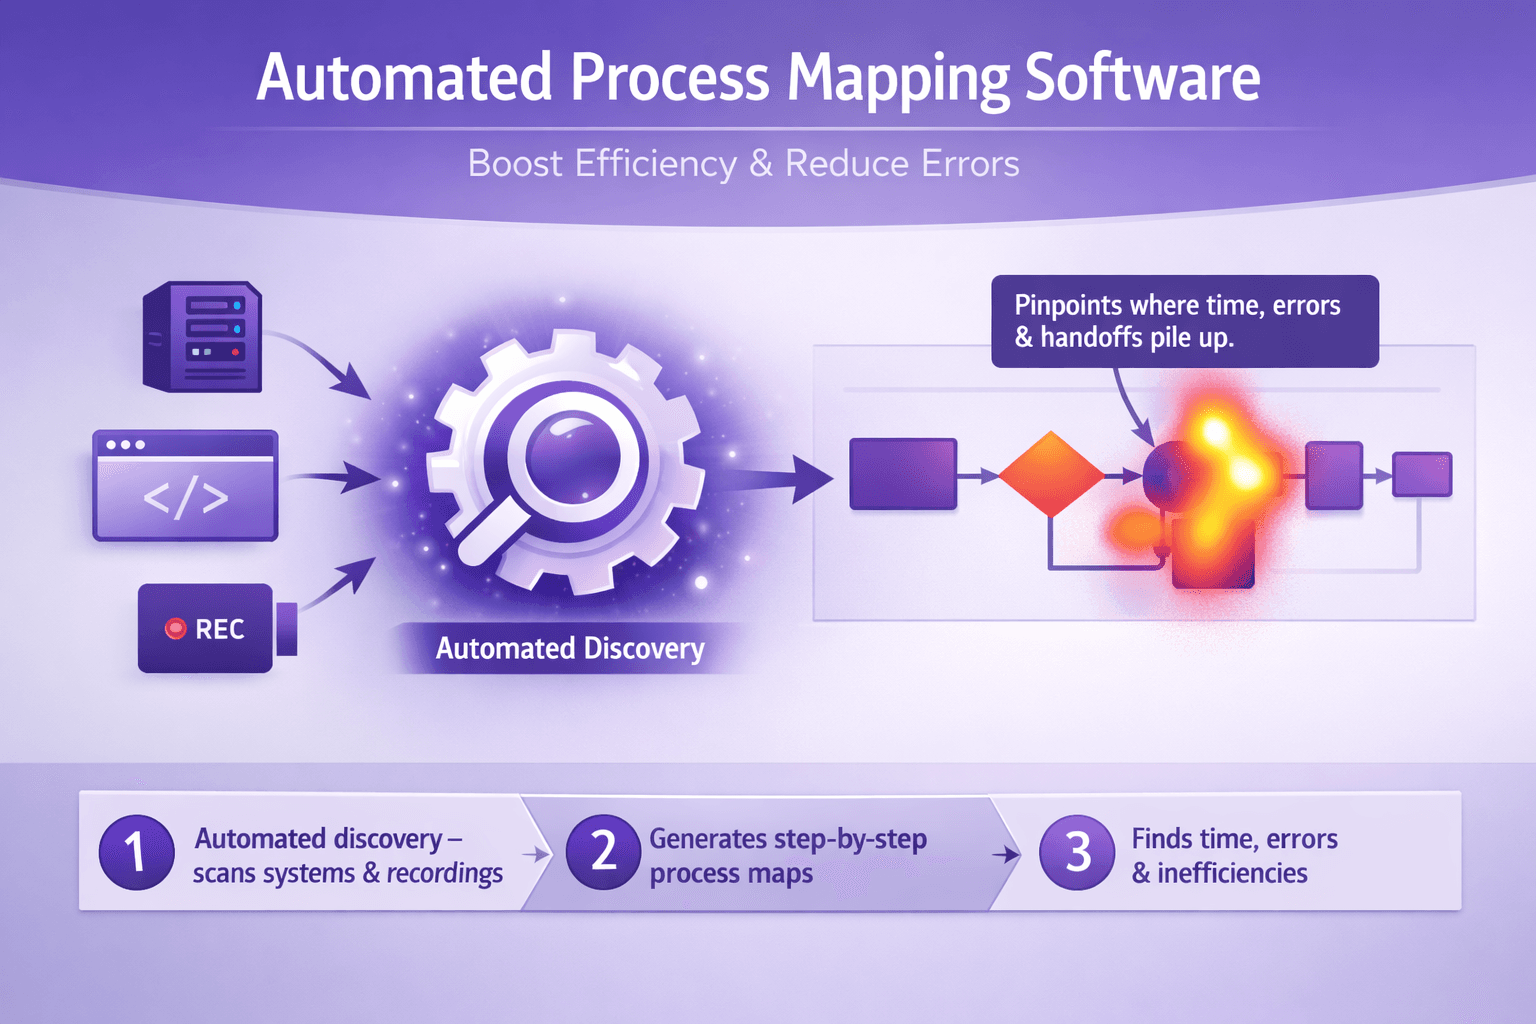
Automated process mapping software turns messy, undocumented work into clear, actionable maps. Instead of asking ten people how a month-end close or a customer refund actually happens, you run automated discovery on the systems and recordings, get step-by-step flows, and see where time, errors, and handoffs pile up.
Who benefits? Business analysts get accurate baselines without weeks of interviews. Consultants can show concrete improvement opportunities to clients. Tech and operations leaders get visibility they can trust — and faster automation rollouts because the process documentation already exists.
Bottom line outcomes: faster automation, fewer rework loops, and clearer process visibility for anyone making decisions about change. If you want to cut cycle time, drop error rates, and make automation projects land faster, automated process mapping software should be on your shortlist.
What Is Automated Process Mapping Software?
At its core, automated process mapping software captures how work actually gets done — from clicks in a UI to system logs and user screen recordings — and turns that into process maps and metadata you can act on.
Core capabilities
- Discovery: Captures events from systems and users. This might be process mining from system logs (SAP, Salesforce) or task mining from screen recordings and UI telemetry.
- Visual mapping: Automatically generates flowcharts, swimlanes, decision points, and alternative paths. Good tools show frequency and time-at-step.
- Metadata capture: Attaches data like average time per step, error frequencies, input/output artifacts, and screenshots or video snippets for context.
How it's different from manual mapping and legacy BPM tools
Manual mapping is slow and subjective. You interview people, open Visio, and end up with something that reflects only what those people remember. Legacy BPM (business process management) tools often expect you to model by hand and assume processes are stable. Real life is messy: variance, exceptions, and hidden shortcuts are common.
Automated process mapping software is empirical. It observes actual behavior, captures variance, and gives you counts and timings. Instead of arguing whether there are five or seven steps, you can say "80% of cases follow this path, 12% take this shortcut, 8% fail at step 4."
Typical data sources and methods
- Task mining: Tools like Microsoft Power Automate Desktop, Kryon, and others collect UI interactions and generate step-level events from screen recordings or agents installed on desktops.
- Process mining: Celonis, UiPath Process Mining, and others analyze event logs from systems (SAP, Oracle, ServiceNow) to reconstruct end-to-end flows.
- User telemetry & screen recordings: Platforms such as Lyren AI process screen recordings and UI videos to produce structured, step-by-step documentation with screenshots and video snippets — particularly useful when there's no clean event log.
- Hybrid approaches: Preferably you combine system logs with task mining and interviews. Each source fills gaps the others leave.
Example: A customer onboarding process might show up in Salesforce logs for account creation, in email server logs for confirmations, and in screen recordings for manual steps where agents copy data between systems. Automated mapping software ties these pieces together into one map with confidence scores.
Key Benefits for Analysts, Consultants, and Operations
Automated process mapping software is not just a time-saver — it changes how you prioritize work and measure outcomes.
Faster, more accurate process documentation and baseline creation
Instead of spending 3–8 weeks on interviews to document a single process, you can create a reliable baseline in days. A banking client I worked with used automated mapping to document 15 core OP processes in four weeks; manual mapping would have taken three months.
Practical tip: Use screen recordings for processes with heavy manual UI work. Tools like Lyren AI turn those videos into step-by-step docs and diagrams you can hand to RPA developers or subject matter experts.
Uncovering hidden inefficiencies and variance across teams
You can't fix what you can't see. Automated maps surface the "long tail" — rare but expensive exceptions, or tiny deviations that, aggregated, cost hours per week. For example, an insurance firm found 28 different ways agents processed a claims intake form; standardizing the top two handled 72% of volumes and cut rework by 40%.
Real example: A healthcare provider found a 12-minute average delay when staff switched between an internal portal and a legacy claims system. That single context switch was adding millions in labor across the year.
Prioritizing automation candidates with data-driven insights
Good process mapping ranks processes by time, frequency, error rate, and automation feasibility. That makes your automation roadmap less opinion and more math. Suppose Process A takes 45 minutes and happens 5,000 times a year; Process B takes 10 minutes but happens 50,000 times. Which to automate? The software gives the numbers to decide.
Practical advice: Build a simple scoring model — Score = (Frequency * Avg Time) * (Error Rate + 0.1) * Automation Complexity Factor. Use that to list top 10 candidates and run a proof-of-concept on the highest-scoring one.
Improving stakeholder alignment with shared visualizations
Stop emailing Excel and sending screenshots. Interactive maps, with screenshots and video snippets attached, get people on the same page fast. When stakeholders can click a step and see the recording of how it's performed, debates end.
Example: During a transformation program, consultants used automated maps in workshops. A disputed step was resolved in seconds once the process owner watched a 20-second clip showing the real behavior.
Must-Have Features When Evaluating Software
Not all tools are equal. Here are the features I insist on when testing automated process mapping software.
Automated discovery and step-level fidelity (task & process mining)
You want step-level fidelity: exact clicks, fields entered, wait times, and screenshots. That’s crucial when passing documentation to RPA developers or training new hires.
- Look for tools that combine task mining (desktop/UI) and process mining (system logs).
- Check sampling and retention controls — you don't want PII leaked or oversized datasets.
- Example: Lyren AI turns UI video into structured steps and can export diagrams — handy when event logs are incomplete.
Intuitive visualization and export options for BPM and RPA tools
Maps should be easy to read and exportable in formats you actually use: BPMN, CSV, Visio, or direct exports to RPA platforms like UiPath or Automation Anywhere.
- Test the export: Does the exported flow keep labels, variants, time metrics?
- Does the tool create swimlanes automatically by role or system?
- Can you filter the map by frequency or time slice?
Integrations with RPA platforms, BI tools, and enterprise systems
Good integrations shorten the path from mapping to action.
- Integrations to test: UiPath, Automation Anywhere, Blue Prism for RPA; Celonis, Power BI, Tableau for analytics; SAP, Salesforce, Workday for event logs.
- Bonus: APIs for programmatic access and data feeds to your data lake.
Collaboration, versioning, and governance controls for cross-team use
If multiple teams will edit or use maps, you need version control, access roles, and governance.
- Look for comment threads, approvals, and the ability to lock a "golden" version for automation handoff.
- Audit logs: who ran discovery, who edited what, and when.
Analytics and recommendations for optimization and automation
Beyond static maps, the software should offer analytics — step durations, bottleneck heatmaps, and recommendations such as "Batch steps 2 and 3" or "Add validation to reduce errors at step 5."
- Watch out for canned recommendations that sound too generic. The best tools ground suggestions in data.
- Tools that predict automation ROI based on observed metrics are especially useful when pitching to executives.
Implementation Roadmap: From Pilot to Scale
Deploying automated process mapping across an organization isn't plug-and-play. Here's a practical roadmap that actually works.
Selecting a pilot process and defining success metrics
Pick a process that’s:
- High volume or high cost (billing, order-to-cash, claims)
- Contains both system and manual steps
- Has an engaged process owner
Define 3–5 success metrics. Examples:
- Cycle time reduction: target 30% faster
- Error rate drop: target 50% fewer exceptions
- Automation throughput: deploy bots that handle X transactions per day
- Time to produce baseline documentation: reduce from 6 weeks to 5 days
Practical example: For an invoice processing pilot: pick invoices with straight-through rates between 40–60% — enough exceptions to learn, not so chaotic you can't automate.
Data collection, validation, and stakeholder interviews
Run discovery for a defined period (2–4 weeks for steady-state processes). Collect:
- System logs (ERP, CRM)
- Screen recordings for key roles (accounts receivable, customer support)
- Interview notes from 2–3 SMEs for context and edge cases
Validation is critical. Automated maps are reliable but not perfect. Bring SMEs into a two-hour walkthrough session where they validate steps, label exceptions, and flag regulatory or security concerns.
Tip: Have SMEs watch short clips tied to problematic steps. They'll correct assumptions fast.
Iterative mapping, validation sessions, and pairing with automation pilots
Use an iterative loop:
- Run initial discovery and produce a baseline map.
- Validate with SMEs and fix misclassifications.
- Pilot automation on 1–2 repeatable paths identified by the map.
- Run discovery again to measure change and capture new behavior.
This pairing of mapping and automation is powerful. For example, a telco automated the top path for SIM activations and saw a 70% reduction in manual handoffs. Subsequent discovery showed agents shifted to handle exceptions — and that led to a second automation opportunity.
Scaling: standard templates, governance model, and center-of-excellence handoffs
When pilots succeed, scale with governance:
- Create standard mapping templates for common process families.
- Define a change control process: how maps update when systems change.
- Set up a Center of Excellence (CoE) that owns mapping standards, tags, and a prioritized automation backlog.
Operational handoff checklist example:
- Golden map exported in BPMN
- Step-level screenshots and video snippets included
- Test data and exception examples attached
- Approved by process owner and security team
Measuring ROI and Key Performance Indicators
Proving value keeps budgets flowing. Here's how to measure and attribute savings.
KPIs to track
- Cycle time: average time from start to completion
- Error rates: percent of cases requiring rework
- Cost per transaction: labor minutes * average fully loaded hourly rate
- Automation throughput: transactions handled by bots per day/week
- Time to onboard: time to produce documentation for new hires
- First-time-right rate: % of transactions completed without correction
Give numbers. For a finance process with 1,000 monthly transactions, 30 minutes average handling time, and $35 fully loaded hourly rate:
- Monthly labor minutes = 1,000 * 30 = 30,000 minutes = 500 hours
- Monthly labor cost = 500 * $35 = $17,500
If mapping-led automation saves 40% of time, monthly savings = $7,000. Annualized ~ $84,000 (not counting improved SLA, reduced penalties).
How to attribute savings to mapping-led automation efforts
Attribution needs baseline and control. Two practical approaches:
- Before-after with normalized volumes: Run discovery for a baseline period and compare metrics after automation for the same volume mix.
- A/B or pilot vs. control team: Automate one team or channel and leave another untouched for comparison.
Document assumptions. If seasonality affects volumes, adjust for that. Capture qualitative benefits too — reduced employee churn because repetitive tasks dropped — and try to assign dollar values where possible.
Reporting cadence and communicating value to executives
Monthly dashboards for CoE and quarterly executive summaries work well.
- Monthly: operational KPIs, top issues, automation throughput, and immediate next steps.
- Quarterly: ROI, cumulative savings, and roadmap adjustments.
Be concise. Execs want: cost saved, risk reduced, and time to value. Use one slide with the headline number and 2–3 supporting charts: trend in cycle time, error rate, and automation throughput.
Common Pitfalls and Best Practices
You’ll hit some bumps. Here’s how to avoid the usual traps.
Pitfalls
- Poor data quality: If logs or recordings are incomplete, maps will mislead. Always check data completeness and capture gaps early.
- Over-automation: Automating every small variant often fails. Focus on the high-volume, low-exception paths first.
- Lack of stakeholder buy-in: If the process owner isn't engaged, the map will be ignored. Make them co-owner of the artifacts.
- Ignoring compliance and data privacy: Task mining can capture PII. Have policies and masking in place before collecting data.
Real example: A retailer automated return handling but hadn’t captured exemption rules from legal. The bot applied wrong refunds in 0.2% of cases, causing regulatory headaches and reputation damage.
Best practices
- Start small: Run one solid pilot with measurable metrics. Expand once you prove value.
- Validate with SMEs: Always pair automated discovery with human review. Automated tools miss intent and business rules sometimes.
- Combine qualitative with quantitative data: Interviews capture rationale; automated mapping captures frequency and timing.
- Mask sensitive data early: Use PII scrubbing or run discovery only on synthetic or anonymized datasets when possible.
- Schedule re-discovery: Systems and work change. Set re-discovery cycles — quarterly for high-change processes, annually for stable ones.
Practical maintenance tip: Add a "process health" column to your governance dashboard. If frequency of exceptions grows by X% or cycle time increases Y%, trigger a re-discovery.
Conclusion
Automated process mapping software gives you the evidence you need to make smarter, faster automation decisions. It shrinks discovery time from weeks to days, surfaces expensive hidden variance, and hands real, actionable maps to RPA developers and process owners. When combined with good governance, stakeholder validation, and a clear metrics model, it moves automation from guesswork to measurable outcomes.
Next steps: evaluate vendors that support both task mining and process mining, run a focused pilot on a high-impact process, and define three success metrics before you start. If you're processing training videos, screen recordings, or want AI-generated flow diagrams attached to documentation, try tools that process UI videos and produce step-by-step documentation — platforms like Lyren AI can speed that part of the work and often cut documentation time by 60–80%.
Actionable checklist to get started
- Pick a pilot process (high volume, mixed manual + system).
- Define 3 success metrics (cycle time, error rate, cost per transaction).
- Collect data for 2–4 weeks: system logs + 10–15 screen recordings.
- Run automated mapping and host a 2-hour validation session with SMEs.
- Prioritize top automation candidate using a simple scoring model.
- Deploy a small automation pilot, measure, and re-discover to confirm gains.
- If successful, roll out templates, governance, and CoE handoffs.
If you want a practical next move: pick one process that drives a lot of toil — say invoice processing, customer onboarding, or claims intake — and run a 30-day discovery pilot. You'll get a baseline, a prioritized list of automations, and enough proof to build a business case.